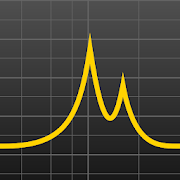
Top 49 Apps Similar to FFT Spectrum Analyzer


PandwaRF 1.15.3
PandwaRF is a RF analysis tool with a sub-1 GHzwirelesstransceivercontrolled by a smartphone or a PC. Its purposeis tocapture,display & transmit RF data very easily. It canbeconnected toan Android smartphone using BLE or USB, and toLinuxusing USB. Itis based on the well-known RfCat & Yard StickOnetools with theTexas Instruments CC1111 RF transceiver, but withalot of newfeatures, making PandwaRF the perfect portableRFanalysis tool.Cheaper, simpler, smaller than a SDR.Hardwarerequired! You can buythe PandwaRF hardwareathttp://pandwarf.com/.


Frequencies 1.8
Find out what the frequency of a specific LPD/LPD 8 / PMR / CB (Citizen Band, 'normal' or UK) / UHF / PRS/FRS/GMRS / KDR / Marine VHF/ AAR (American Assocation ofRailroads)channel is and the CTCSS tone code of a subchannel.Do you have a 2 meter / 70 cm band radio and want tocommunicatewith someone with a Marine VHF / PMR / LPD / UHF / PRS /KDR /FRS/GMRS / AAR radio? Is that one also using 'subchannels'?Thisapp is what you need!Select which type you need and select the channel andsubchannel.The app calculates / converts the channel. Thefrequency (in MHz)and CTCSS frequency (in Hz) / tone code are thenshown.Or select the frequency (of a channel or subchannel) andthenearest channel will be shown, if it is nearby the givenfrequency.Select the tab 'frequency' at the bottom of the app tomake use ofthis functionality.Possible types:- PMR- KDR- LPD- LPD8- CB (Citizen Band)- CB UK (Citizen Band UK)- UHF (often used in Australia)- PRS (often used in New Zeeland)- FRS / GMRS- FRS- Marine VHF- AAR (American Assocation of Railroads)There is also a free version of this app with ads. Ads andpaidversion are just to support the app development andsubscription tothe stores. Please tell me if you would like to havemore featuresor supported radio types.App icon by icons8.com / iconsdb.comIdea by http://portoshop.nl


vibration analysis 1.0
Acceleration measurement and determination of therelevantfrequency,the acceleration and the amplitude of theoscillationExplanation ofthe buttons arranged on top of the screenCONTI:Continuousmeasurement 5 SEC: Fixed measurement duration of 5sec,then STOPautomatically STOP: Stop of measurement, the last5seconds aredisplayed -: In stop mode, move zoom window(1.28sec)to the left,only for PRO version +: In stop mode, movezoom window(1.28sec) tothe right, only for PRO version There aresevenfigures below thebuttons. Upper figure "Currentaccelerationvalues": Theaccelerations values are displayed. Thesamplingfrequency of mostsmartphones is 50 Hz. If the actualsamplingfrequency deviates by ±1 Hz, then the actual samplingfrequencyappears (flashing).Different times must then becorrectedaccordingly. The numericallydisplayed measured valuesarecorrected automatically. During a swipeaction "from bottom lefttotop right", the APP goes into adiagnostic mode. Then theactualsampling frequency, the standarddeviation of thesamplingfrequency and an internal counter appear.Underneathfigure"Accelerations over time": It shows theaccelerations curveof thelast 5 seconds. After pressing STOP, awindow of 1.28 sec ismarked(vertical black bars). in PRO version:the window can bemoved by±, after a double-tap on the figure itappears twice aslarge,after another double-tip it is resized again.Swipe up, swipedownto change the scaling. Underneath figure"Largest of thethreeacceleration components curve": It shows theaccelerationcomponentwith the maximum acceleration change. The zoomwindowisrepresented by 1.28 sec. It is particularlysuitableforoscillation frequencies from 1 Hz to 15 Hz. The moresinusoidalthetime signal, the more secure are the determinedvalues.Indiagnostic mode, trigger points and sineapproximationsarevisible. In PRO version: after a double tip on thefigureitappears twice as large, after another double-tip itisresizedagain. Swipe up, swipe down to change thescaling.Underneathfigure "Numerical evaluation from the timesignal":Hereevaluations from the time domain are displayednumerically. Inthediagnostic mode, the number of detectedvibrations aredisplayed.Sx is their standard deviation. The largern and smallerSx, thesafer the values determined. The accelerationamplitudealsospecifies a standard deviation. The calculation isdone withtheleast square method. Underneath figure "FFT-writingoftheacceleration over time": Here, a plot of theaccelerationspectrumover time is shown. Shown are the last 5seconds. The zoomwindowis marked. In PRO version: after a doubletip on the figureitappears twice as large, after another double-tipit isresizedagain. Swipe up, swipe down to change theintensityscale.Underneath figure "FFT spectrum of the zoom window":It showstheFFT spectrum within the zoom window. The black curveistheresulting acceleration. In PRO version: after a double tiponthefigure it appears twice as large, after another double-tipitisresized again. Swipe up, swipe down to changethescaling.Underneath figure "FFT, numeric": It is the numericoutputof theFFT spectrum within the zoom window. The maximum of theFFTisindicated by a cross. Frequency, Amplitude andmaximumaccelerationvalues are shown.